POE 2 Complete PC Freeze while loading screen

"
0:011> k
# Child-SP RetAddr Call Site
00 000000c3`6bbf7810 00007ff7`fe110a47 KERNELBASE!RaiseException+0x8a
01 000000c3`6bbf7910 00007ff7`fe107020 PathOfExileSteam+0x2360a47
02 000000c3`6bbf7980 00007ff7`fe1d1d18 PathOfExileSteam+0x2357020
03 000000c3`6bbf79b0 00007ff7`fe106f80 PathOfExileSteam+0x2421d18
04 000000c3`6bbf79e0 00007ff7`fe0fde9e PathOfExileSteam+0x2356f80
05 000000c3`6bbf7a10 00007ff9`263a3886 PathOfExileSteam+0x234de9e
06 000000c3`6bbf7ae0 00007ff7`fca05dc9 ntdll!RcConsolidateFrames+0x6
07 000000c3`6bbffb20 00007ff9`24ace8d7 PathOfExileSteam+0xc55dc9
08 000000c3`6bbffb80 00007ff9`2633bf2c KERNEL32!BaseThreadInitThunk+0x17
09 000000c3`6bbffbb0 00000000`00000000 ntdll!RtlUserThreadStart+0x2c


"

(212c.22fc): Unknown exception - code e0000001 (first chance)
First chance exceptions are reported before any exception handling.
This exception may be expected and handled.


Here we go again. Hey, at least we have Map stash tab #sarcasm
Ok, so because I was angry and my pc still freezes I was investigating the bug a bit more and it seems to be a deadlock at first glance. I triggered the bug multiple times with multiple breakpoints.

This is the thread that calls RaiseException (the following stack strace is right before calling RaiseException):
"
0:017> k
# Child-SP RetAddr Call Site
00 000000ea`a29f83a0 00007ff7`fe110a47 PathOfExileSteam+0xd78fd
01 000000ea`a29f83d0 00007ff7`fe107020 PathOfExileSteam+0x2360a47
02 000000ea`a29f8440 00007ff7`fe1d1d18 PathOfExileSteam+0x2357020
03 000000ea`a29f8470 00007ff7`fe106f80 PathOfExileSteam+0x2421d18
04 000000ea`a29f84a0 00007ff7`fe0fde9e PathOfExileSteam+0x2356f80
05 000000ea`a29f84d0 00007ff9`263a3886 PathOfExileSteam+0x234de9e
06 000000ea`a29f85a0 00007ff7`fca05dc9 ntdll!RcConsolidateFrames+0x6
07 000000ea`a29ffd50 00007ff9`24ace8d7 PathOfExileSteam+0xc55dc9
08 000000ea`a29ffdb0 00007ff9`2633bf2c KERNEL32!BaseThreadInitThunk+0x17
09 000000ea`a29ffde0 00000000`00000000 ntdll!RtlUserThreadStart+0x2c


so PathOfExileSteam+0xd78fd looks like this in assembly:

"
.text:00000001400D78E0 Function proc near ; DATA XREF: Function+4↓o
.text:00000001400D78E0 ; sub_1400E33C0+E↓o ...
.text:00000001400D78E0 sub rsp, 28h
.text:00000001400D78E4 lea rdx, Function ; Function
.text:00000001400D78EB mov ecx, 16h ; Signal
.text:00000001400D78F0 call signal
.text:00000001400D78F5 xor r9d, r9d
.text:00000001400D78F8 xor r8d, r8d
.text:00000001400D78FB xor edx, edx
.text:00000001400D78FD mov ecx, 0E0000001h <--- this is the exception code and here is the address where i put a bp
.text:00000001400D7902 add rsp, 28h
.text:00000001400D7906 jmp cs:RaiseException
.text:00000001400D7906 Function endp


Now we know that an exception is generated but we need to find what causes this exception. Since sometimes the instance loading was working I was thinking about investigating some race condition.
"

0:017> !locks

CritSec +88061350 at 000001fc88061350
WaiterWoken No
LockCount 0
RecursionCount 1
OwningThread 18f0
EntryCount 0
ContentionCount 1820
*** Locked


So we have a critical section that is owned by thread with threadId 0x18f0.

Those are all the threads:
"

0:017> ~
0 Id: 4e84.38c Suspend: 1 Teb: 000000ea`9903e000 Unfrozen "MainThrd"
2 Id: 4e84.5558 Suspend: 1 Teb: 000000ea`99196000 Unfrozen
3 Id: 4e84.3d00 Suspend: 1 Teb: 000000ea`991ae000 Unfrozen
4 Id: 4e84.32d4 Suspend: 1 Teb: 000000ea`99198000 Unfrozen
6 Id: 4e84.fe4 Suspend: 1 Teb: 000000ea`991b8000 Unfrozen
7 Id: 4e84.dfc Suspend: 1 Teb: 000000ea`9904c000 Unfrozen
8 Id: 4e84.3240 Suspend: 1 Teb: 000000ea`99080000 Unfrozen
9 Id: 4e84.4c0 Suspend: 1 Teb: 000000ea`99082000 Unfrozen
10 Id: 4e84.3efc Suspend: 1 Teb: 000000ea`99084000 Unfrozen
11 Id: 4e84.51bc Suspend: 1 Teb: 000000ea`99086000 Unfrozen
12 Id: 4e84.55ac Suspend: 1 Teb: 000000ea`99088000 Unfrozen
13 Id: 4e84.1ecc Suspend: 1 Teb: 000000ea`9908a000 Unfrozen
14 Id: 4e84.44e8 Suspend: 1 Teb: 000000ea`9908c000 Unfrozen
15 Id: 4e84.5048 Suspend: 1 Teb: 000000ea`9908e000 Unfrozen
16 Id: 4e84.5114 Suspend: 1 Teb: 000000ea`99090000 Unfrozen
. 17 Id: 4e84.3948 Suspend: 1 Teb: 000000ea`99092000 Unfrozen
18 Id: 4e84.53b0 Suspend: 1 Teb: 000000ea`99094000 Unfrozen
19 Id: 4e84.4534 Suspend: 1 Teb: 000000ea`99096000 Unfrozen
20 Id: 4e84.449c Suspend: 1 Teb: 000000ea`99098000 Unfrozen
21 Id: 4e84.54dc Suspend: 1 Teb: 000000ea`9909a000 Unfrozen
22 Id: 4e84.567c Suspend: 1 Teb: 000000ea`9909c000 Unfrozen
23 Id: 4e84.4dec Suspend: 1 Teb: 000000ea`9909e000 Unfrozen
24 Id: 4e84.53b8 Suspend: 1 Teb: 000000ea`990a0000 Unfrozen
25 Id: 4e84.5754 Suspend: 1 Teb: 000000ea`990a2000 Unfrozen
26 Id: 4e84.1a08 Suspend: 1 Teb: 000000ea`990a4000 Unfrozen
27 Id: 4e84.33d8 Suspend: 1 Teb: 000000ea`990a6000 Unfrozen
28 Id: 4e84.2f2c Suspend: 1 Teb: 000000ea`990a8000 Unfrozen
29 Id: 4e84.436c Suspend: 1 Teb: 000000ea`990aa000 Unfrozen
30 Id: 4e84.2bbc Suspend: 1 Teb: 000000ea`990ac000 Unfrozen
32 Id: 4e84.134c Suspend: 1 Teb: 000000ea`990b0000 Unfrozen
33 Id: 4e84.18f0 Suspend: 1 Teb: 000000ea`990b2000 Unfrozen <--- thread that owns the lock
34 Id: 4e84.2408 Suspend: 1 Teb: 000000ea`990b4000 Unfrozen
35 Id: 4e84.259c Suspend: 1 Teb: 000000ea`990b6000 Unfrozen
36 Id: 4e84.4564 Suspend: 1 Teb: 000000ea`990b8000 Unfrozen
37 Id: 4e84.5398 Suspend: 1 Teb: 000000ea`990ba000 Unfrozen "BinkAsy0"
38 Id: 4e84.4744 Suspend: 1 Teb: 000000ea`990bc000 Unfrozen "BinkAsy1"
39 Id: 4e84.4ff0 Suspend: 1 Teb: 000000ea`990f2000 Unfrozen
41 Id: 4e84.3354 Suspend: 1 Teb: 000000ea`990fa000 Unfrozen
42 Id: 4e84.2bc8 Suspend: 1 Teb: 000000ea`990fc000 Unfrozen
43 Id: 4e84.21cc Suspend: 1 Teb: 000000ea`990fe000 Unfrozen "sl.log"
44 Id: 4e84.5490 Suspend: 1 Teb: 000000ea`99116000 Unfrozen
45 Id: 4e84.2374 Suspend: 1 Teb: 000000ea`9911a000 Unfrozen
46 Id: 4e84.5778 Suspend: 1 Teb: 000000ea`9911c000 Unfrozen
47 Id: 4e84.2c78 Suspend: 1 Teb: 000000ea`9911e000 Unfrozen
48 Id: 4e84.b00 Suspend: 1 Teb: 000000ea`99120000 Unfrozen
49 Id: 4e84.2314 Suspend: 1 Teb: 000000ea`99122000 Unfrozen "D3D Background Thread 0"
50 Id: 4e84.5674 Suspend: 1 Teb: 000000ea`99124000 Unfrozen "D3D Background Thread 1"
51 Id: 4e84.1a0 Suspend: 1 Teb: 000000ea`99126000 Unfrozen "D3D Background Thread 2"
52 Id: 4e84.1494 Suspend: 1 Teb: 000000ea`99128000 Unfrozen "D3D Background Thread 3"
53 Id: 4e84.3440 Suspend: 1 Teb: 000000ea`9912a000 Unfrozen
54 Id: 4e84.1798 Suspend: 1 Teb: 000000ea`9912c000 Unfrozen
55 Id: 4e84.4f30 Suspend: 1 Teb: 000000ea`9912e000 Unfrozen
56 Id: 4e84.5748 Suspend: 1 Teb: 000000ea`99130000 Unfrozen
57 Id: 4e84.4eb8 Suspend: 1 Teb: 000000ea`99132000 Unfrozen
58 Id: 4e84.33f0 Suspend: 1 Teb: 000000ea`99134000 Unfrozen
59 Id: 4e84.28e4 Suspend: 1 Teb: 000000ea`99136000 Unfrozen
60 Id: 4e84.11b0 Suspend: 1 Teb: 000000ea`99138000 Unfrozen
62 Id: 4e84.4e24 Suspend: 1 Teb: 000000ea`9913c000 Unfrozen
63 Id: 4e84.3494 Suspend: 1 Teb: 000000ea`9913e000 Unfrozen
64 Id: 4e84.1340 Suspend: 1 Teb: 000000ea`9914a000 Unfrozen
66 Id: 4e84.2124 Suspend: 1 Teb: 000000ea`9914e000 Unfrozen
68 Id: 4e84.10fc Suspend: 1 Teb: 000000ea`99152000 Unfrozen
71 Id: 4e84.2a84 Suspend: 1 Teb: 000000ea`99164000 Unfrozen
72 Id: 4e84.1f58 Suspend: 1 Teb: 000000ea`99170000 Unfrozen


And this is the stacktrace for the thread that owns that critical section:
"
0:017> ~[33] k
# Child-SP RetAddr Call Site
00 000000ea`b61ff9e8 00007ff9`262f3524 ntdll!NtWaitForAlertByThreadId+0x14
01 000000ea`b61ff9f0 00007ff9`23afde78 ntdll!RtlSleepConditionVariableSRW+0x1c4
02 000000ea`b61ffa90 00007ff9`23a23d2d KERNELBASE!SleepConditionVariableSRW+0x38
03 000000ea`b61ffad0 00007ff9`23a1f4a9 msvcp_win!Concurrency::details::stl_condition_variable_win7::wait+0x19
04 000000ea`b61ffb00 00007ff8`7f4ee7ea msvcp_win!Cnd_wait+0x19
05 000000ea`b61ffb30 00007ff8`7f4ee704 D3D12Core!BackgroundTaskScheduler::Scheduler::TaskThread+0xb6
06 000000ea`b61ffc60 00007ff9`238837b0 D3D12Core!std::thread::_Invoke<std::tuple<<lambda_d1dcd43984ff6503e4a6a4b61a501ad9> >,0>+0x14
07 000000ea`b61ffc90 00007ff9`24ace8d7 ucrtbase!thread_start<unsigned int (__cdecl*)(void *),1>+0x30
08 000000ea`b61ffcc0 00007ff9`2633bf2c KERNEL32!BaseThreadInitThunk+0x17
09 000000ea`b61ffcf0 00000000`00000000 ntdll!RtlUserThreadStart+0x2c


RecursionCount 1 suggests that thread 33 (TID == 0x18f0) took the lock once and somehow when the crash occurs that thread is in ntdll!NtWaitForAlertByThreadId+0x14

Now about the LockCount member from the CRITICAL_SECTION struct. In this case LockCount == 0

"
LockCount This is the most important field in a critical section. It is initialized to a value of -1; a value of 0 or greater indicates that the critical section is held or owned. When it's not equal to -1, the OwningThread field (this field is incorrectly defined in WINNT.H—it should be a DWORD instead of a HANDLE) contains the thread ID that owns this critical section. The delta between this field and the value of (RecursionCount -1) indicates how many additional threads are waiting to acquire the critical section.


So in this case LockCount - (RecursionCount - 1) is 0, meaning that there is no other thread waiting to acquire the critical section but somehow that critical section is still locked :| . So it seems like some kind of deadlock.

I hope this helps and this bug will be fixed....
I will try to investigate it further when I have some time
"
IceCool10#6669 написал:
Ok, so because I was angry and my pc still freezes I was investigating the bug a bit more and it seems to be a deadlock at first glance. I triggered the bug multiple times with multiple breakpoints.

I hope this helps and this bug will be fixed....
I will try to investigate it further when I have some time


From what I've seen:

First of all: All the first few frames are from PathOfExileSteam, meaning the crash originates within the game’s own code, not a system DLL (like ntdll.dll or KERNEL32.dll).

The code here is also seems to be a recurring or a looping one unless they are all together within one single manager.

This is a stack unwinder: "06 000000ea`a29f85a0 00007ff9`263a3886 ntdll!RcConsolidateFrames+0x6"

It is used when Windows unwinds the stack after an exception.

"jmp cs:RaiseException at 0x1400D7906" suggests this function deliberately triggers an exception. As in the code itself calls the exception. This is not a standard Windows exception such as 0xC0000005 for access violation or 0xC00000FD for stack overflow. It is probably their debug process.

Now normally if I were to see something like this without having the context I would say this function is part of an error reporting system and its job is to ensure that when something unexpected happens, the game crashes in a controlled manner rather than behaving unpredictably.

In our case however, for some reason it doesn't do that and instead behaves unpredictably. Like you have said this is probably due to a deadlock.

Since Lock Count is 0 it means no thread has attempted to acquire the lock after thread 18f0 locked it and since Recursion Count is 1 this is the first and only lock acquisition by this thread.

"ContentionCount 1820" means that 000001fc88061350 has been requested 1820 times by other threads. So the problem is here. Since WaiterWoken is No, no thread has been released from waiting on this lock. The thread 18f0 is holding it firmly.

Further down the line you have used k to see that

There is probably a wake signal that is commented out.

Because the thread is not actively running but is waiting indefinitely inside SleepConditionVariableSRW() - this is by the way a standard system API used for thread synchronization, it makes a thread wait (sleep) until another thread signals a condition variable. It is implemented in KERNELBASE.dll and internally calls RtlSleepConditionVariableSRW() from ntdll.dll.

So the only way I can think of that can lead this to happen is that the thread is waiting on a condition variable that never comes due to faulty programming.

This is a thread synchronization issue:
1) The thread belongs to Direct3D 12's background task scheduler.

2) It is inside a task loop, but instead of executing work, it is waiting for a condition to be met.

3) This means it is expecting another thread to push work into the queue and notify it, and that may not be happening.

This is not an immediate crash. The thread is stuck waiting for a condition variable that never gets signaled.

The system freezes because other threads are likely waiting on this one, causing a cascading stall.

Which is what we have been experiencing since 2 months. The game engine mishandles worker thread synchronization. If the GPU is waiting for CPU work and the CPU is waiting for a GPU response, the system enters a fatal deadlock.

My guess is a commented out code.

To debug this we need to find which other thread was supposed to call WakeConditionVariable().

If you have time could you please use send the full result when you run !stacks.

We can then look for threads that are waiting on a lock or another condition variable and/or threads that might have been responsible for signaling Thread 33.

Obligatory:
If only GGG were honest we would not even have to have this conversation... We could simply look at GGGs explanation of the situation with proper technical information but we can never know why exactly this is happening as GGG keeps being dodgy and dishonest. By the way, Microsoft is still not acknowledging this is a Windows 11 24H2 issue as claimed by GGG.

As long as GGG is not interested in open and honest communication our only other option is to increase the pressure and warn others by giving a negative review for Path of Exile 2 on Steam in a detailed and informative manner.
I cannot send/reply to direct messages because my in-game character has not finished Act 1.
What to do:
1)Write a short review about the hard crashes in notepad.
2)Copy and paste it to steam reviews, put up a negative review.
3)Copy and paste it to steam discussions, put it up there.
Последняя редакция: Cainrith#2807. Время: 17 февр. 2025 г., 18:28:13
After countless hours and money spent on trying to figure out why my game was crashing I finally determined the root cause.

For those of you with an i9 14900k go to your bios settings and sync all pcore ratios to 55. This completely fixed the game for me and I'm even able to use directx12 with everything on high settings
And the newest version of windows 24h2

I hope this helps someone

Good luck out there exiles
Последняя редакция: glitche#2433. Время: 18 февр. 2025 г., 23:57:27
Even after the new patch. still hard crashing. this sucks.
Reminder to use the "--ex-crash-report" to send crash report data to GGG whenever you crash.

(freeze or crash, both works)

For Steam:

Goto Library->Path of Exile 2 properties by right-clicking the icon->General->Launch Option-> Add --ex-crash-report
to the box.


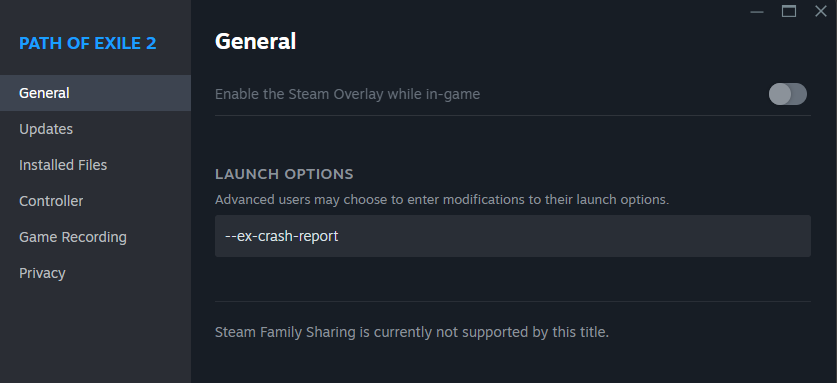
For Standalone client:

Right the desktop shortcut->Properties->In the target field add --ex-crash-report


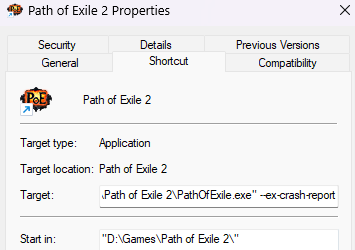
Последняя редакция: Climet#7103. Время: 18 февр. 2025 г., 06:37:18
"
Cainrith#2807 написал:
"
IceCool10#6669 написал:
Ok, so because I was angry and my pc still freezes I was investigating the bug a bit more and it seems to be a deadlock at first glance. I triggered the bug multiple times with multiple breakpoints.

I hope this helps and this bug will be fixed....
I will try to investigate it further when I have some time


From what I've seen:

First of all: All the first few frames are from PathOfExileSteam, meaning the crash originates within the game’s own code, not a system DLL (like ntdll.dll or KERNEL32.dll).

...


Something tells me the two of you would have solved this issue in 1 day if you where given permissions to the actual code.

Would be so sad but hilarious if the actual issue is because someone commented out code somewhere in the engine that no-one dares to touch anymore. Or if it were their own doing even: like "This piece of code don't seem to do anything .. load-times will likely be a bit faster if we just remove it"

We will likely never know, but lets hope that the info might help them solve the issue. Im actually rooting for them. I believe no fans of the genre actually wants to see GGG fail.

This old crappy engine they are using is really staring to become a huge problem though.

Последняя редакция: snurrfint#5780. Время: 18 февр. 2025 г., 09:03:25
Because I have some time I tried to investigate the hang some more. But then I saw that there was an update and I tried to generate the hang "burning" some low tier maps. Entering the map and then go back to hideout and after like 10+ maps I had 0 crashes :). Idk what happened and idk if my last analysis helped GGG but at first glance it seems to be fixed

// LE: Nvm. Just got a crash
Последняя редакция: IceCool10#6669. Время: 18 февр. 2025 г., 13:21:56
can't play since I "upgraded" to windows 11...

online up to 5-10mins.

hard crash, freeze...

this is rubbish!

fix it please.

DxDiag has been sent.
I gave up and uninstalled the game.

Good luck.

Пожаловаться на запись форума

Пожаловаться на учетную запись:

Тип жалобы

Дополнительная информация